Turkey Machinery Industry
According to TUİK’s data, the machinery sector realized 109 billion TL in turnover and 27 billion TL value added with 13.371 enterprises and 243.550 employment in 2018, while exports reached USD 17.15 billion with an increase of 15 percent and reached a historical value of 64%. However, the most foreign trade deficit given after energy in our country is the machinery sector, and almost all of the developed industrial countries have foreign trade surplus, which is why it is of great strategic importance for our country..
Regional Structuring
In the figure below, the provinces where the machinery manufacturing companies are concentrated are indicated and a lower number of companies operate in the other provinces. According to TUİK figures, 2/3 of the company engaged in 13.371 machinery manufacturing operates in six provinces. While Istanbul is home to 3.520 firms which is 26% of all, there are 1.452 firms in Ankara, 1.132 firms in Konya, 1.074 firms in Izmir, 665 firms in Bursa and 431 firms in Kocaeli.
Machinery industry in Turkey are divided into three main regional structure. The distribution to provinces of industrialist manufacturers total of 13.302 as of year-end 2018 according to information collected Turkey Union of Chambers and Exchanges Commodities’ industry data base, is detailed collectively in the table are presented. Accordingly, the three main regional structures in the machinery industry are as follows;
Large provinces; Istanbul, Ankara, Izmir, Konya, Kocaeli and Bursa. These six provinces account for 72.6 percent of producers (72.4 percent in 2017) and 79.8 percent of exports (80.1 percent in 2017).
Medium-sized provinces; It consists of Eskişehir, Manisa, Gaziantep, Adana, Kayseri, Çorum, Tekirdağ, Balıkesir, Sakarya and Aydın, Denizli, Antalya, Samsun, Mersin and Düzce. These provinces account for 19.2 percent of producers (19.7 percent in 2017) and 19 percent of exports (19.0 percent in 2017).
Other Provinces; in the machinery industry, it accounts for 8.2 percent of producers (7.9 percent in 2017) and 1.2 percent of exports (0.9 percent in 2017).
Considering the sub-machine sectors
The sub-sectors in which Istanbul is relatively dominant compared to other provinces in almost every field of machinery production but mostly in general purpose machines which cannot be categorized in other sub sectors, cooling and ventilation machines, pumps and compressors, taps, vanes, valves, metal processing machines and textile and plastic-rubber machines.
Construction equipment, lifting and stacking machines, cooling and ventilation equipment and defense industry equipment are mainly produced in Ankara.
Production and refrigeration and ventilation equipment, lifting and stacking machines, general-purpose machines and pump compressors and food machines are predominant in İzmir.
Konya concentrates in the production of agricultural and forestry machinery, food machinery, lifting and handling equipment, engines and turbines and fluid power equipment as well as metal processing, bearings, faucets, vanes, valves and pump compressors.
Bursa mainly produces metal processing and machine tools, lifting and transportation equipment, cooling and ventilation equipment and agricultural - forestry and food machinery.
In Kocaeli, cooling and ventilation equipment, general-purpose and special-purpose machines, construction machinery and lifting and transportation machines are mainly produced.
In Eskişehir defense industry, in Manisa cooling ventilation and agricultural and forestry machinery, Gaziantep textile and food machinery, in Adana agricultural and forestry machinery, in Kayseri lifting and transportation equipment and general purpose machinery, Tekirdağ agricultural and forestry machines are mainly producing.
In the machinery sector, there are 3 machine specialized OIZs which are called Kocaeli Gebze VI (IMES) Machinery Specialized OIZ (Kocaeli-Dilovası), Machinery Specialized OIZ (Kocaeli-Dilovası) and Sakarya Kaynarca East Marmara Machinery Manufacturers Specialized OIZ (Sakarya-Kaynarca).
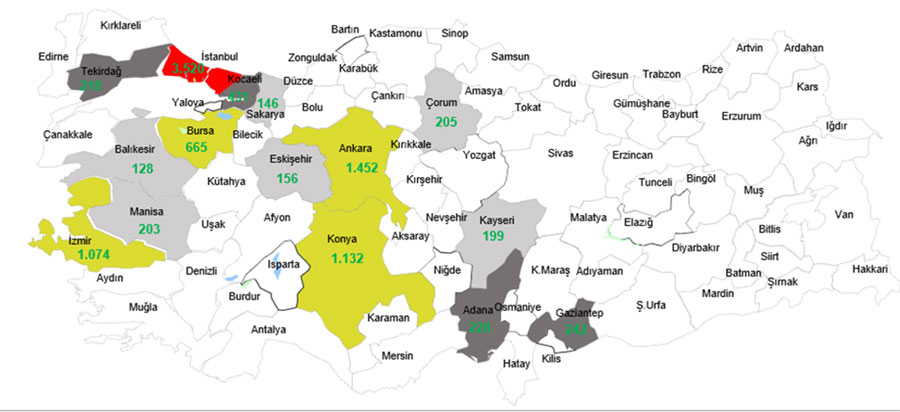
Figure 1 - Density Map by Number of Companies in Machinery Sector (Source: MAKFED Publications)
Turkey's Foreign Trade Machine
As seen in Table 2, machinery exports increased by 14.5 percent in 2018 and rose from $ 14.99 billion to $ 17.16 billion. The highest increase in exports was recorded in annual terms. In terms of sub-product groups, the highest increase in exports in machinery sub-groups was recorded in construction and mining machinery sub-group with 34.1 percent. In the sub-industry of hoisting and stacking machines, exports increased by 31.4 percent. In 2018, air conditioners and refrigeration machines sub-industry group made the highest export value of 2.28 billion dollars.
Table 2- Machine Export Values
|
|
Thousand Dollars |
Thousand Dollars |
Change |
|
AIR CONDITIONERS AND COOLING MACHINES |
2.002.559 |
2.282.911 |
14,0 |
|
INTERNAL COMBUSTION ENGINES, PARTS AND PARTS |
2.171.352 |
2.222.035 |
2,3 |
|
WASHING AND DRYING MACHINES, ACC. AND PARTS. |
1.460.031 |
1.640.811 |
12,4 |
|
OTHER MACHINES, COMPONENTS AND PARTS |
1.385.138 |
1.568.597 |
13,2 |
|
MACHINERY USED IN CONSTRUCTION AND MINING, ACC. AND PARTS. |
910.424 |
1.221.123 |
34,1 |
|
PUMPS AND COMPRESSORS |
810.578 |
966.823 |
19,3 |
|
MACHINE TOOLS |
721.740 |
854.195 |
18,4 |
|
MACHINERY USED IN AGRICULTURE AND FORESTRY, AKS. AND PARTS. |
653.723 |
830.898 |
27,1 |
|
TEXTILE AND APPAREL MACHINES ACC. AND PARTS. |
605.200 |
722.086 |
19,3 |
|
TURBINE, TURBOJET, TURBOPROPELLER, HYDRAULIC CYLINDERS AND PARTS |
641.697 |
711.437 |
10,9 |
|
VALVES |
499.888 |
578.752 |
15,8 |
|
REACTORS AND BOILERS |
515.306 |
576.308 |
11,8 |
|
FOOD INDUSTRY MACHINERY, ACC. AND PARTS. |
493.885 |
542.863 |
9,9 |
|
ELECTRIC MOTORS AND GENERATORS |
443.191 |
520.281 |
17,4 |
|
HEATERS AND OVENS |
320.705 |
376.928 |
17,5 |
|
ROLLING AND CASTING MACHINES, MOLDS, AXLES. AND PARTS. |
336.644 |
375.216 |
11,5 |
|
MACHINES FOR LOADING, TRANSPORTING AND STACKING PARTS. |
282.538 |
371.335 |
31,4 |
|
RUBBER, PLASTIC, TIRE PROCESSING AND MANUFACTURING MACHINES |
167.930 |
212.356 |
26,5 |
|
PACKAGING MACHINERY, PARTS AND PARTS |
172.261 |
192.965 |
12,0 |
|
OFFICE MACHINES |
152.058 |
143.816 |
-5,4 |
|
BEARINGS |
133.774 |
136.438 |
2,0 |
|
MACHINERY FOR PAPER PRODUCTION AND PRINTING |
89.498 |
96.567 |
7,9 |
|
LEATHER PROCESSING AND MANUFACTURING MACHINES, ACC. AND PARTS. |
14.931 |
13.123 |
-12,1 |
|
TOTAL |
14.985.052 |
17.157.866 |
14,5 |
Source-TÜİK
Imports of machinery declined by 5.3 percent in 2018 as shown in Table 3 and decreased from USD 29.8 billion to USD 28.23 billion. In terms of sub-product groups, the sharpest decrease in imports from machinery sub-groups was recorded in construction and mining machinery sub-group with 34.3 percent. The highest increase in imports was in textile and apparel machinery with 31.0 percent. In 2018, the highest importation was made by the internal combustion engines and components sub-industry group with 4.53 billion dollars.
Table 3- Machine Import Values
|
|
Imports |
Imports |
Change |
|
INTERNAL COMBUSTION ENGINES AND PARTS |
4.593 |
4.530 |
-1,4 |
|
OTHER MACHINES |
3.889 |
3.847 |
-1,1 |
|
OFFICE MACHINES |
2.799 |
2.360 |
-15,7 |
|
PUMPS AND COMPRESSORS |
2.125 |
1.997 |
-6,0 |
|
TEXTILE AND APPAREL MACHINES |
1.477 |
1.936 |
31,0 |
|
TURBINES, TURBOJETS, HYDRAULICS |
1.761 |
1.844 |
4,7 |
|
MACHINE TOOLS |
1.703 |
1.652 |
-3,0 |
|
ELECTRIC MOTORS, GENERATORS AND PARTS |
1.483 |
1.474 |
-0,7 |
|
CONSTRUCTION AND MINING MACHINES |
2.056 |
1.351 |
-34,3 |
|
LOADING, CARRYING AND STACKING MACHINES |
1.205 |
1.034 |
-14,2 |
|
VALVES |
1.184 |
1.032 |
-12,9 |
|
AIR CONDITIONERS AND COOLING MACHINES |
1.099 |
986 |
-10,3 |
|
HEATERS AND OVENS |
801 |
693 |
-13,5 |
|
RUBBER AND PLASTIC MACHINES |
583 |
629 |
7,9 |
|
ROLLING AND CASTING MACHINES, MOLDS |
461 |
628 |
36,3 |
|
MACHINERY USED IN AGRICULTURE AND FORESTRY |
658 |
461 |
-30,0 |
|
BEARINGS |
449 |
414 |
-7,9 |
|
PACKAGING MACHINES |
419 |
355 |
-15,4 |
|
MACHINERY FOR PAPER PRODUCTION AND PRINTING |
288 |
352 |
22,5 |
|
FOOD INDUSTRY MACHINERY |
262 |
272 |
3,7 |
|
REACTORS AND BOILERS |
289 |
218 |
-24,4 |
|
WASHING AND DRYING MACHINES |
201 |
148 |
-26,5 |
|
LEATHER PROCESSING AND MANUFACTURING MACHINES |
16 |
15 |
-9,4 |
|
TOTAL |
29.803 |
28.226 |
-5,3 |
Source-TÜİK